
 https://thestrategyweb.com/wp-content/uploads/2020/06/MMG-Ammersee-Coronavirus-2020.jpg
405
540
The Strategy Web
https://thestrategyweb.com/wp-content/uploads/2017/11/strategywebLogo-300x139.png
The Strategy Web2020-06-17 16:44:292020-06-17 17:01:38Sustaining life – a series of quarantined thoughts
https://thestrategyweb.com/wp-content/uploads/2020/06/MMG-Ammersee-Coronavirus-2020.jpg
405
540
The Strategy Web
https://thestrategyweb.com/wp-content/uploads/2017/11/strategywebLogo-300x139.png
The Strategy Web2020-06-17 16:44:292020-06-17 17:01:38Sustaining life – a series of quarantined thoughtsWe believe in the opportunities of digital transformation and digital innovation. Our mission is to support business leaders on their way towards digital competence.
Digital transformation is opening up undreamt-of possibilities for companies: Understand your customers better, develop completely new ways of approaching them and work more efficiently than ever.
But technology is changing quickly, and so do people’s needs and expectations. Business leaders are forced to question their existing business models: Is my way of creating value, of working, still right and the most effective one? What do customers, employees and stakeholders really expect from my business? Who are my competitors? Which information and data is important for my business, where do I find it and how can I use it?
More than
10
Years Consulting
73
Customers
200
Concepts
350
Call-To-Actions (Workshops)
Together with our clients, we find the answers to these and many more questions.
https://thestrategyweb.com/wp-content/uploads/2020/06/MMG-Ammersee-Coronavirus-2020.jpg
405
540
The Strategy Web
https://thestrategyweb.com/wp-content/uploads/2017/11/strategywebLogo-300x139.png
The Strategy Web2020-06-17 16:44:292020-06-17 17:01:38Sustaining life – a series of quarantined thoughts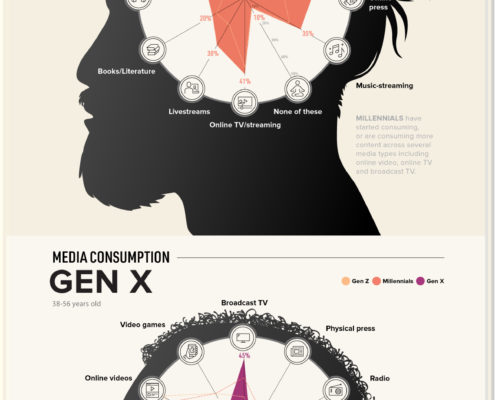 https://thestrategyweb.com/wp-content/uploads/2020/05/COVID_Media_Habits_GWI_2020-scaled.jpg
2560
641
The Strategy Web
https://thestrategyweb.com/wp-content/uploads/2017/11/strategywebLogo-300x139.png
The Strategy Web2020-05-18 13:42:202020-05-18 13:43:06Generation Gap: How the Coronavirus changed media consumption and trust
https://thestrategyweb.com/wp-content/uploads/2020/05/COVID_Media_Habits_GWI_2020-scaled.jpg
2560
641
The Strategy Web
https://thestrategyweb.com/wp-content/uploads/2017/11/strategywebLogo-300x139.png
The Strategy Web2020-05-18 13:42:202020-05-18 13:43:06Generation Gap: How the Coronavirus changed media consumption and trust https://thestrategyweb.com/wp-content/uploads/2020/02/BCW-2020.png
322
675
The Strategy Web
https://thestrategyweb.com/wp-content/uploads/2017/11/strategywebLogo-300x139.png
The Strategy Web2020-02-20 18:54:272020-02-21 07:57:56Bosch Connected World 2020 – The human unicorn on AI
https://thestrategyweb.com/wp-content/uploads/2020/02/BCW-2020.png
322
675
The Strategy Web
https://thestrategyweb.com/wp-content/uploads/2017/11/strategywebLogo-300x139.png
The Strategy Web2020-02-20 18:54:272020-02-21 07:57:56Bosch Connected World 2020 – The human unicorn on AI https://thestrategyweb.com/wp-content/uploads/2020/02/Social-Media-Mobile.jpg
853
1280
The Strategy Web
https://thestrategyweb.com/wp-content/uploads/2017/11/strategywebLogo-300x139.png
The Strategy Web2020-02-06 17:13:102023-05-08 12:04:41Study: Social Media more important for customer service
https://thestrategyweb.com/wp-content/uploads/2020/02/Social-Media-Mobile.jpg
853
1280
The Strategy Web
https://thestrategyweb.com/wp-content/uploads/2017/11/strategywebLogo-300x139.png
The Strategy Web2020-02-06 17:13:102023-05-08 12:04:41Study: Social Media more important for customer service https://thestrategyweb.com/wp-content/uploads/2019/03/Airbus-Air-Taxi-2019.jpg
675
1280
The Strategy Web
https://thestrategyweb.com/wp-content/uploads/2017/11/strategywebLogo-300x139.png
The Strategy Web2019-03-13 14:33:482019-03-14 11:45:58Mobility in 2050? Drones, visions and more…
https://thestrategyweb.com/wp-content/uploads/2019/03/Airbus-Air-Taxi-2019.jpg
675
1280
The Strategy Web
https://thestrategyweb.com/wp-content/uploads/2017/11/strategywebLogo-300x139.png
The Strategy Web2019-03-13 14:33:482019-03-14 11:45:58Mobility in 2050? Drones, visions and more…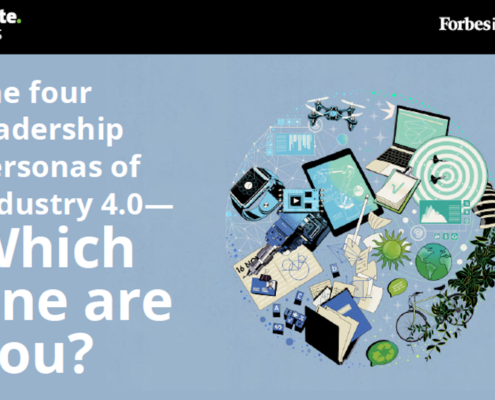 https://thestrategyweb.com/wp-content/uploads/2019/01/Deloitte-Study-Leadership-Industry-4.0-2019-1.png
821
1280
The Strategy Web
https://thestrategyweb.com/wp-content/uploads/2017/11/strategywebLogo-300x139.png
The Strategy Web2019-01-31 15:17:542019-01-31 15:57:43Study: Leadership in Industry 4.0 – which persona are you?
https://thestrategyweb.com/wp-content/uploads/2019/01/Deloitte-Study-Leadership-Industry-4.0-2019-1.png
821
1280
The Strategy Web
https://thestrategyweb.com/wp-content/uploads/2017/11/strategywebLogo-300x139.png
The Strategy Web2019-01-31 15:17:542019-01-31 15:57:43Study: Leadership in Industry 4.0 – which persona are you? https://thestrategyweb.com/wp-content/uploads/2018/08/milky-way-1023340_1280.jpg
853
1280
Andreas Schulze-Kopp
https://thestrategyweb.com/wp-content/uploads/2017/11/strategywebLogo-300x139.png
Andreas Schulze-Kopp2018-08-24 17:40:142018-08-27 08:19:28The slightly other infografic about the social media universe
https://thestrategyweb.com/wp-content/uploads/2018/08/milky-way-1023340_1280.jpg
853
1280
Andreas Schulze-Kopp
https://thestrategyweb.com/wp-content/uploads/2017/11/strategywebLogo-300x139.png
Andreas Schulze-Kopp2018-08-24 17:40:142018-08-27 08:19:28The slightly other infografic about the social media universe https://thestrategyweb.com/wp-content/uploads/2018/08/auto-2651594_1280.png
853
1280
Andreas Schulze-Kopp
https://thestrategyweb.com/wp-content/uploads/2017/11/strategywebLogo-300x139.png
Andreas Schulze-Kopp2018-08-01 10:52:412018-08-01 10:52:41Are you ready for the next level of future mobility? Young Germans are!
https://thestrategyweb.com/wp-content/uploads/2018/08/auto-2651594_1280.png
853
1280
Andreas Schulze-Kopp
https://thestrategyweb.com/wp-content/uploads/2017/11/strategywebLogo-300x139.png
Andreas Schulze-Kopp2018-08-01 10:52:412018-08-01 10:52:41Are you ready for the next level of future mobility? Young Germans are! https://thestrategyweb.com/wp-content/uploads/2018/06/ipad-605440_1280.jpg
850
1280
Andreas Schulze-Kopp
https://thestrategyweb.com/wp-content/uploads/2017/11/strategywebLogo-300x139.png
Andreas Schulze-Kopp2018-06-07 11:43:552018-06-07 11:43:55Internet Trends 2018 – Mary Meeker Report
https://thestrategyweb.com/wp-content/uploads/2018/06/ipad-605440_1280.jpg
850
1280
Andreas Schulze-Kopp
https://thestrategyweb.com/wp-content/uploads/2017/11/strategywebLogo-300x139.png
Andreas Schulze-Kopp2018-06-07 11:43:552018-06-07 11:43:55Internet Trends 2018 – Mary Meeker Report