Tag Archive for: Google

When sensors make cars feel (Vivid Light Festival)

At the Vivid Sydney, Festival of Light, Music and Ideas, the team of Soap Creative made cars feel. The installation was implemented into some cars with sensors and projections from inside the car to their windows in order to illustrate some artificial intelligence that made cars come to life, showing feelings as well as motivating people passing by to do something like hug them, and then responding. The campaign was supported by the hashtag #CarsThatFeel by Toyota. The whole idea reaching more than one million Australians who came to the Sydney Harbour to watch the interactive art show.

PS: I just wondered how cool the self-driving Google cars would have reacted on their first ride.

What do you think of the creative idea?

Vimeo

By loading the video, you agree to Vimeo's privacy policy.
Learn more

Load video

Infographic: How Google Ranks Your Website's Relevance

Google Rank WebsitesThis is one of those secrets that is discussed in every single seminar we do: How does Google rank websites? Why does my website not rank higher than my competitors? What could be the best SEO strategy so that Google ranks us under the first three results?

The Google’s algorithm is one of the biggest secrets in the marketing world. The 200+ ranking features make it very challenging to find the right web strategy of your content and website structure. So, what’s the best way to develop a “Google-loves-us” strategy?

Neil Patel has created a nice infographic that illustrates the main components of the Google algorithm. Let’s see what he comes up with…

How Google Determines Where to Rank Your Website
Courtesy of: Quick Sprout

Spot On!
The main challenge to drive more traffic via search lies in understanding the holistic approach of Google’s algorithm. Obviously, it is about the final user that works with the website, reads the content and shares it through their own social communication platforms. Over are those days when people though the “link-in-link-out” game will solve the SEO war, when companies got paid for building link farms, and people got money to bring more links in. In the end, the user decides on what they need, and finally the Google Algorithm reflects that.

Study shows, how B2B decision-makers consume vendor content

Some weeks ago, we spoke about a study that described what B2B decision makers expect to read on vendor websites. Now, a new study of 352 buyers (predominantly large businesses) from The CMO Council and NetLine shows that the majority of organizations (94%) favors to curate and circulate relevant content in their organization before finally deciding to purchase B2B solutions and services. For years, marketers thought B2B buyers and influencers alike are simply using vendor-related content from time to time.

The study makes clear that there is no real sharing structure to be made out from company to company. However, there are three main patterns that the study highlights in their results:
From the Middle Out (35%): Execution-level executives search and find content about vendors/products and make the purchase. Senior management gets educated thorugh them why the decision was made.
From the Bottom Up (30%): Junior or mid-level employees find vendor-related content and share their discoveries with senior management. Then they make the final decision.
From the Top Down (29%): Senior managers find the content, then share it with lower-level managers for analysis and final purchase.

CMO Council Netline B2B content sharing

The same as with the sharing patterns, there are three key personas within the businesses who act according to their own behaviors, expectations and needs.
Researchers: Primarily focused on new industry reports/research to inform them of advancements in solutions, trends affecting the markets, and opportunities for improvement.
Influencers: Interested in both thought leadership found in trusted third-party channels and vendor-branded technology specifications, data sheets, and use cases. Their special interest is in summarized content, i.e. infographics, videos, and blog comments.
Decision-Makers: Want to stay informed through broad research reports and analyst commentary. However, they expect to have access to detailed data to enable better decision-making at the tail end of the purchasing funnel.

Spot On!
The study reveals some further interesting insights. The vendor selection is major to moderate influenced by online content, find 88% of the B2B buyers and more than a third (38%) find that online content provides strategic insights and shapes the purchase decision. The content that is valued the most is research reports and studies (65%), technical spec and data sheets (50%), analyst reports (46%), whitepapers (35%) and posts on trade publishing sites (30%). The power of Google and the vendor website comes out as well: When more than two third state they start their vendor-related content sourcing with search engines and portals, it shows that the best training the marketers is to read the two B2B studies and draw some conclusion out of it for the future of your own content, PR and marketing acitivites. And if you cannot find a solution, we are happy to help…

How fast the leading social networks are growing…

It is one of these questions, we always get asked in meetings and seminars. How much is social media growing, or is growth already declining? Search Engine Journal provides some good overview on the topic of growth and use in an infographic just recently released.

The most popular sites -in terms of how they are used by marketers- are still Facebook, Twitter, and Google+. Same as in the study from Global Web Index in 2013, Twitter still shows the fastest growth in social networks from an active user perspective, especially in the 55-64 age group.

In the time period from June 2012 to March 2013, Google+ increased their active user base by 33%. The age group of 45-54 years showed the fastest adaption growth in Google+ with a 56% increase.

And Facebook? Although they showed a 23% increase, especially the age group of 45-54 years is adapting the fast moving “Likes and Hypes” network.

SEJ-Social-Media-Growth

Study: Why corporate newsrooms fail to meet journalists' needs

Credits: © momius - Fotolia.com

Credits: © momius – Fotolia.com

The value of corporate newsrooms has been discussed for years. Now, a recent Proactive Report survey by Sally Falkow, president of PRESSfeed: The Social Newsroom, gives insights into what the power of newsrooms could be and where journalists stand so far with them. The survey strikes the fact that the PR industry hasn’t adapt to the latest image- and video-based environment that users and journalists alike are looking for; especially videos and embedded codes which only one third of the newsrooms surveyed offered. The report makes clear that the majority of journalists (83%) sees images with content important, still just 38% of them add images to news content.

From Falkow’s perspective, many corporate newsrooms do not provide the content and links that journalists “are looking for, and things they think are important, and things that make their jobs easier for them, and that they would therefore use that content more readily.” The value of pictures for content could be seen when Twitter started displaying pictures in peoples’ feeds, so that users did not have to click the link connected with it, she states.

The main findings from the survey…
– Just 37% of online newsrooms provide videos and embedded codes compared to 82% of journalists asking for it
– 49% of online newsrooms fail to meet the standards of images for publications, only 39% of corporate newsrooms offer an image gallery
– 53% of journalists find video important with content, but only 13% of PR professionals are adding videos to their news, and only one third have a video gallery in their newsroom

So, the question is why companies fail with their newsrooms? Sally Falkow’s answer is as simple as it is obvious: “The No. 1 reason that they quote is lack of resources and, also very close behind, lack of skills. They don’t know how to do it.” Based on the knowledge of their 2013 newsroom study, Peter Ingman, founder of the newsroom technology platform Mynewsdesk, responded: “The power of images and videos have become central parts when coaching companies on how to set up newsrooms with our technology. Providing news and information to journalists has to be three things: simple, simple, simple! It has to be an easy process of uploading data for companies and easy to implement the appropriate content articles and posts for the media contacts. Journalists need to have or find the essential data for their reports and articles without challenging search activities. Come, find, implement – this is the key to successful newsrooms!”

Spot On!
The way journalists work has not changed drastically over the last decade in the way investigating for the news content works. Check the media, check Google, check the brands. Newsrooms offer new opportunities to journalists, social influencers and brand advocates to access data faster with an “everything-at-a-glance” perspective. The use of implemented analysis tools, clever SocialCRM technology, and by changing the way employees are allowed to speak for their brands via online channels, newsrooms foster brand and trust building. However, newsrooms can sometimes be of good and bad experience as the standard in companies newsrooms varies, apart from the different technologies that companies use, from self-developed platforms to personalized SaaS newsrooms.

Often enterprises have got newsrooms up and running already like Daimler, AUDI, ING or Costa Coffee. Still, most SMBs don’t even think about it as they are still relying on their traditional way of spreading news via content distribution platforms – an outdated way in terms of the value it provides for SEO, and even more (or less?) for journalists. Companies should start thinking about providing value with their newsroom in the form of video quotes or brief updates or blog posts alongside photos about the latest developments or news in the company or the market. Quick and simple information bites that come via tweets, Facebook updates or direct mail out of platforms straight to the editor, optimized according to their user behavior. It will make a massive impact on brand reputation and the way journalists will work with corporate newsrooms in the future.

Content: Secrets of a killer blogpost (Infographic)

Many marketing, PR or product managers think about starting their own blogs when joining one of our inhouse or open seminars. And for most of them, it has become a challenge just finding the right topic that makes them outstanding with their product or service offering. This is not surprising, bearing in mind that there were already 74.874.233 WordPress websites out there when I wrote this post – and when you think about Blogger, Typepad, Tumblrs and all of those enterprise blogs, it becomes a mission impossible to find a niche that helps building brands.

Now, the guys at WhoIsHostingThis.com have published some helpful infographic which give us some quite good arguments on what matters when you start blogging.

Which Content?
There is no magazine without a smashing title. Ideally, you write about the topics you are an expert in. As people will want credible, meaningful and authentic blog posts, this is the only way to get your readers attention. Then, check out what readers do want, discuss and share on your topic via social media monitoring. This will make your content interesting and will prevent you from writing content that nobody reads.

Original or Curated?

If you have got the time to write original content, go for it. It’s the best for your reputation and shows your own mindset. And most importantly, Google likes original content which is more likely to rank better. Whenever, there are guest bloggers who want to contribute to your website, invite them.
However, the truth is that if you curate your competitor’s content or third party content from time to time (with a back link!), you jump into their fish-bowl. The easiest bit is if you use their infographics, webinars and branded industry blogs to expand their ideas and thoughts.

Consistency? 

Find your style and stick with it. People want to feel “at home” and comfortable. Figure out when most people share your updates, or when it’s better not to send them live. If you can afford it, stick to an editorial calendar as people love publishing source they can rely on finding the relevant set of information that stands out.

Good luck (and if you need help), we are here to advice…

How-to-Write-a-Successful-Blog-Post

Best and worst times to post social media updates (Infographic)

The questions we get asked by management team all over Europe are quite similar whenever it comes to best possible conversion times, or perfect hours and days to posting on social networks, to send out updates and to generate engagement. Although this might be an option to boost your social and web activities, it should be clear to everyone that if we all obey these options, we are challenging our clients more and more in generating engagement.

Above all, not all social media platforms are alike. The user types of social networks are different, depending on whether these are coming with a purchase intent, the idea to keep their friends up to date about their latest spare time activities, or whether they are looking for new job opportunities in career networks. Sentiment, time and openness for your updates might vary from minute to minute.

Mitt Ray summarizes some advice on when could be the best and worst time to publish your updates on Facebook, Google+, Twitter, Linkedin, Pinterest and Tumblr. Take it for whatever it is worth to you…

Best-Times-and-Days-to-Post-Your-Social-Media-Updates-Infographic

Study 2014: What marketers see as their top priorities

Obviously, all marketers are ROI-driven – or made to think that way. Not surprising then, the top priority in digital marketing comes to be increasing the conversion rates (47%), followed by increasing/improving brand awareness (46%) and collecting/measuring/using behavior-based data (29%). This is the outcome of the latest study by ExactTarget entitled “2014 State of Marketing”. The report, conducted between October and November 2013, gives insights from over 2,600 global marketers.

ExactTarget-2014-top-priorities-exacttarget

Although I would have expected from our conversations with clients that demand generation comes in as one of the top priorities, only 28% of the marketers said acquiring new subscribers, improving channels (24%) and leveraging actionable data is among their main challenges for 2014.

ExactTarget-2014-success-metrics

The good sign for publishers, consultants, advertising platforms and marketing service providers is that 98% of responding marketers plan to increase or maintain their digital marketing budgets. The rise in digital marketing spends goes primarily to data and analytics (61%), marketing automation (61%), email marketing (58%), social media marketing (57%), and content management (57%).

ExactTarget-2014-budgets

Spot On!
It would actually be interesting to have a study that asks marketers what they define as social media marketing. Why? Interestingly enough, only 34% of those marketers find ROI in social media marketing. As of a lack of definition, we cannot argue whether there is a misunderstanding in the definition or in the company’s approach to social media. Still, only 52% think their social media activities will actually pay out in ROI. But when Facebook, Twitter, and LinkedIn are cited as the most popular social channels for the respondents, I doubt that their social media approach is properly understood. At least there are positive signs when the repondents see that Google+ gets more impact with 18% planning to start in 2014.

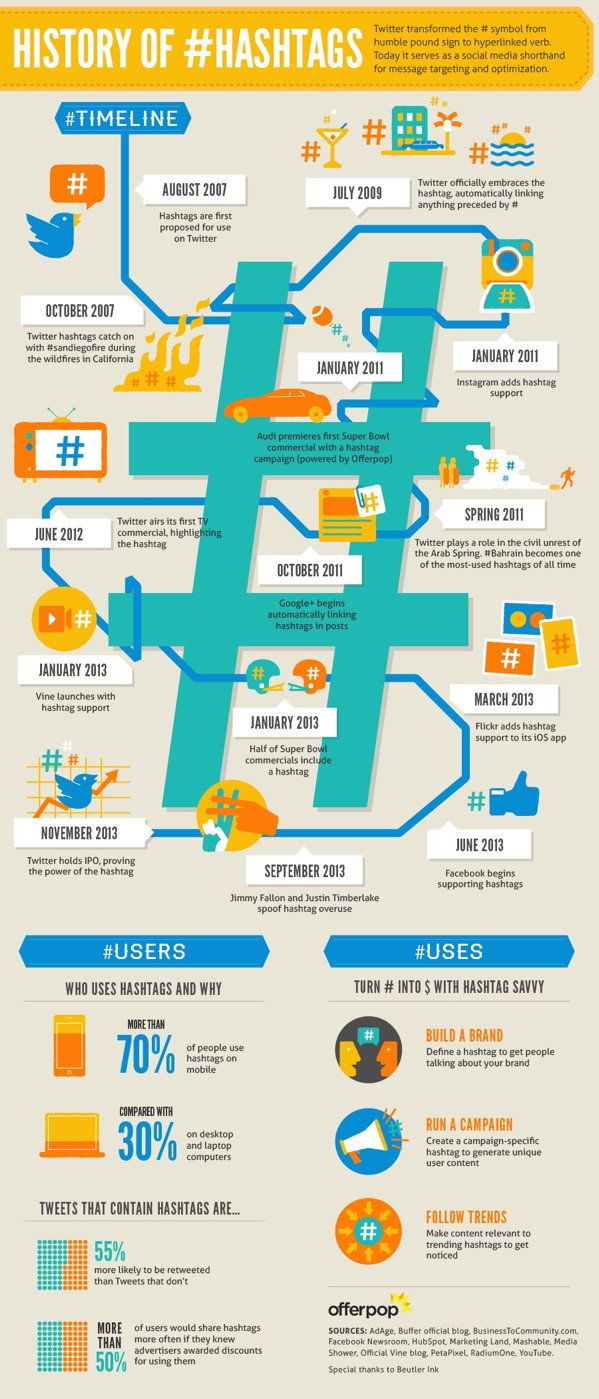
History of Hashtags (Infographic)

Whether you use hashtags “#” or not, they have made their history since first introduced in 2007 by Twitter. They became the filter, not only for Twitter – also for special topics, for branding, for trends, and for what not.

Although many people ignored hashtags from the beginning on the social platform, they find more and more acceptance today, now that people know why they are in the world of social web communication. Their real increase in use cam with the year 2009, when the 140 character network decided automatically linking anything preceded by the pound sign.

Nowadays, if you want to get retweets, you better use hashtags as these tweets are 55% more likely to be shared than those without any #. Even Google+, Facebook, Instagram or Vine have started to accept the hashtag value. And Offerpop now introduced an interesting infographic which shows the history of the hashtag.

PS: Interesting to see that more people use hashtags on their mobiles than on their laptops or desktops. Mobile information is consumed in short time periods, so you better make sure people grab your information when they jump on the bus, the train or at a break at an event. Hashtags are the access keys!

History-of-Hashtags-Infographic

Travel: The Hyper-Connected Digital Elite (Infographic)

When I am on (biz) travel to see clients, I am very much a cross-platform user. Sometimes, I book and buy from my tablet, then from my smartphone, and less often via my laptop. In the hotel room, I use my laptop, at the airport lounge the tablet comes into play, and between meetings more often I just use my smartphone: 3 screens, always-on but hard to catch for marketers.

True? Well, some recent by Google states that almost two thirds of travelers are interested to book and buy travel products “whenever they can” and “wherever they can”. It becomes clear that hyper-connected travelers spend 30% more than less-connected travelers. As you can read from the infographic by Monetate the always-on active travelers show some significant purchase habits…

– 74% of travel consumers who use tablets were under 45 years
– 40% of travelers plan their trips via smartphones and tablets
– 32% of business travellers use smartphones to book their travel (under 30 years)
– 7.5% of all online travel bookings came from tablets

Digital-Elite-Travellers-Infographic