Tag Archive for: Instagram

Influencer Trust and Recommendation – A real challenge for marketers (Infographic)

Some years ago and in many seminars, we make clear that the 3Rs of social consumers will revolutionize the sales world: ratings, reviews and recommendations. However, the question arises what make people recommend brands and services? What is their intrinsic motivation or human driver that makes them push out more positive comments around a brand.

A recent infographic by Social Media Link pulled together the most important findings of a study that surveyed 24.000 social media consumers. Still, the best customer experience that leverages recommendations is “a positive experience with the brand” (93%) and “receiving a free product or sample” (79%). On the other hand, a poor customer experiences motivates sharing, too. 71% stated “a negative experience with a brand” makes them write a review as well.

The survey respondents also mentioned that they are more likely to trust a product recommendation on Facebook than any other social network (71%), followed by Instagram with only 38%.

Not surprisingly, Facebook and retailer websites ist he place to discover new brands and services (53%). However, for purchasing the retailer becomes more important and after purchasing a product people use predominantly Facebook to share their buy (54%) – again Instagram comes in second place.

Spot On!
Now, when you think you just need to give a free product to someone, it makes them write a review or recommendation, you might be wrong. Although, 88% trust friends’ and family members’ reviews when these write about their give free product in exchange, the bloggers only come in at 78%. BUT: Is payment included in exchange for the review, trust-level goes down – especially at bloggers to 48%. Still, the best way ist o have apersonal story which is authentic, not animated and personal.

social-media-recommendations-infographic-2015

The use of Facebook, Twitter, Pinterest, Tumblr and Instagram in 2015 (Infographic)

The social networking landscape is changing massively over the last years. Curation and aggregation of content becomes a big game changer through new ways of sharing, new platforms and modern technologies. Some new data from eMarketer explains the main gains and chains of social networking.

“Let’s face it: As much as we complain about those over-sharers who inundate us with baby photos and vacation snapshots, we’re still in love with social networking.” Debra Aho Williamson, Pricipal Analyst, eMarketer

The next big thing will be mobile social networking, where Twitter, Instagram, Pinterest and Tumblr will become the prominent players. So, let’s see how eMarketer predicts the social networking future for the next two years.

eMarketer Social Networking 2015

Social Network Leaders for Business

Adobe’s CMO.com did a great job in summarizing the leading social networks for business in one nice infographic alongside their CMO Guide to The Social Landscape. The marketing technology company checked each of the platforms according to four criteria: brand awareness, customer communication, SEO and traffic generation.

Obviously and not surprising, the leading platforms are Twitter, Facebook, LinkedIn and YouTube. From our experience not all marketers are aware of the importance to change the contents for each platform and not just run them in different timings. The target-groups on the various platforms may be quite different, thus their interests in content and context as well as their wants and needs might vary extremely – although they might be the same people sometimes.

YouTube will probably become the leading platform when the whole world is more driven by Millennials and their input. Although you might be thinking about funny videos, going viral now, most of the business content can be manuals, employer branding stuff, or even product explanation videos. The opportunities are massive and it is time for marketers to realize.

In the B2B space, Slideshare might be a new platform for marketers. The chances are big here as well, as companies and brands get the option to show presentations from various standpoints. Especially, if the company is addressing different stakeholders in a purchase process, it is sometimes good to open up some thoughts before the meeting, so stakeholders can prepare. And, how often did presentations before meetings not go through as of company email file restrictions…?!

Obviously, Google+, Instagram, Pinterest play a role from a corporate brand perspective. And Google+ especially from a SEO and content marketing point of view. However, we are still at the beginning and every case needs to be evaluated on its own.

Any important platform you are missing in the top 8 social networks?

CMO_Social_Landscape_2014

Websites that teens love (Infographic)

Are teens real trendsetters when it comes to using the latest online gig or social networks? Well, Niche gives some insights into the websites that 7.000 high school graduates in the U.S. were using lately.

Although many of us would have thought that Facebook is not the biggest hype for them any longer, the interactive infographic provided by Niche proves that 87% of the graduates are still happy with reading their news and being active on Facebook. Instagram makes up 66% and Twitter is used by 55%.

In terms of quick chat platforms, 72% use Facebook Messenger and 65% are active on Snapchat. Those platforms that are said to be the latest trend like YikYak and Whisper are not really getting big activity rates – 97% and 95% don’t use these platforms.

From a broadcasting point of view, it is interesting to see that YouTube, Netflix, and Pandora are the leading edge platforms whereas Hulu, Spotify and Beats like Amazon Prime are not yet their main interest spot.

PS: The interactive infographic with further info can be seen at Business Insider.

Websites Teens Niche 2014

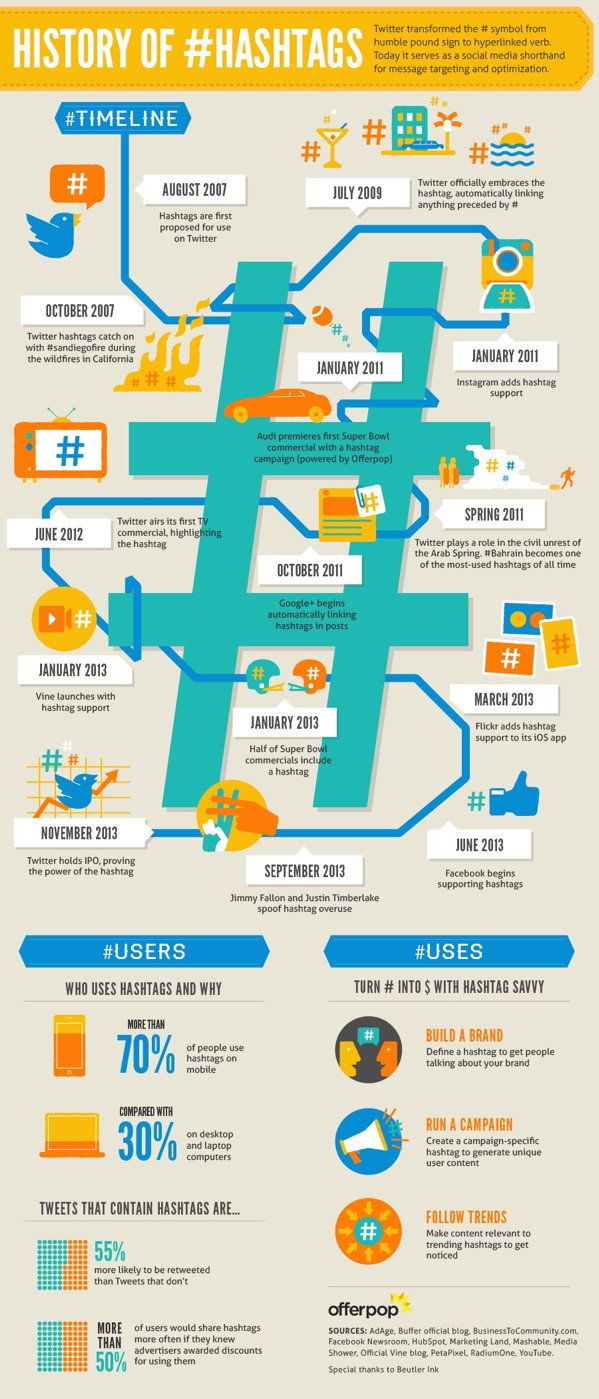
History of Hashtags (Infographic)

Whether you use hashtags “#” or not, they have made their history since first introduced in 2007 by Twitter. They became the filter, not only for Twitter – also for special topics, for branding, for trends, and for what not.

Although many people ignored hashtags from the beginning on the social platform, they find more and more acceptance today, now that people know why they are in the world of social web communication. Their real increase in use cam with the year 2009, when the 140 character network decided automatically linking anything preceded by the pound sign.

Nowadays, if you want to get retweets, you better use hashtags as these tweets are 55% more likely to be shared than those without any #. Even Google+, Facebook, Instagram or Vine have started to accept the hashtag value. And Offerpop now introduced an interesting infographic which shows the history of the hashtag.

PS: Interesting to see that more people use hashtags on their mobiles than on their laptops or desktops. Mobile information is consumed in short time periods, so you better make sure people grab your information when they jump on the bus, the train or at a break at an event. Hashtags are the access keys!

History-of-Hashtags-Infographic

Success: How picturess get more engagement on Instagram

The Philadelphia-based viaul analytics and marketing company, Curalate, states it created algorithms to figure out how more than 30 picture features, like color, lightness or saturation, might effect your Instagram success. To generate these insights, the specialists analyzed over 8 million images from the mobile photo-sharing network. I am assuming this also counts for Instagram’s competitors like Pinterest (if not then Curalate needs to provide some proof please).

Some key findings…
– Photos with a high volume of blues and other cool colors seem to generate more likes than photos with warm red and orange.
– Dominant single colors in images are also more successful. Pictures with clear single hue generate 40% likes than others.
– Less color wins. Don’t flood your pictures with too many flashy and vibrant colors. Less saturated images generate 18% more likes than wild and vibrant ones.

instagram-success-engagement-infographic